All Posts

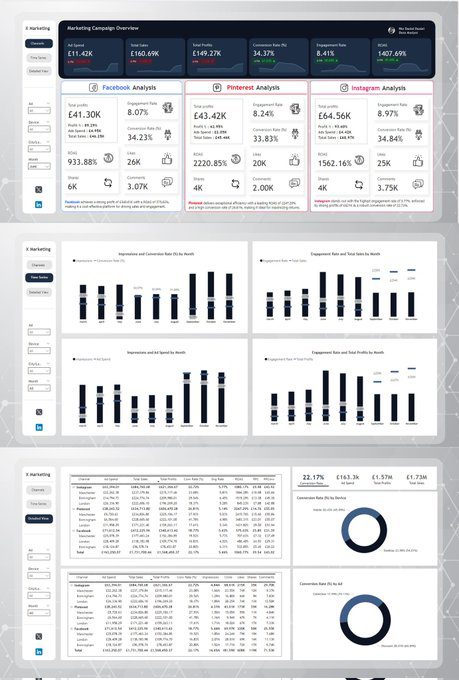
Discover how to enhance your data storytelling in Power BI by combining matrix and column/bar charts. This tutorial provides a step-by-step guide to creating comprehensive visualizations that can transform complex data into actionable insights. Perfect for business intelligence, data analysis, and performance tracking.
AI Critical Thinking
Discover how R's powerful libraries and packages can transform your approach to time series analysis. From data preprocessing to advanced forecasting models, learn the essential steps to unlock valuable insights from your temporal data. Dive into the world of R and elevate your data science skills.
Power BI KPI
Discover how to elevate your data analytics with advanced KPIs in Power BI. This comprehensive tutorial covers everything from creating impactful visuals to leveraging AI for deeper insights, ensuring your business stays ahead in the data-driven world. Dive in to transform your data into actionable growth strategies.
Power BI KPI
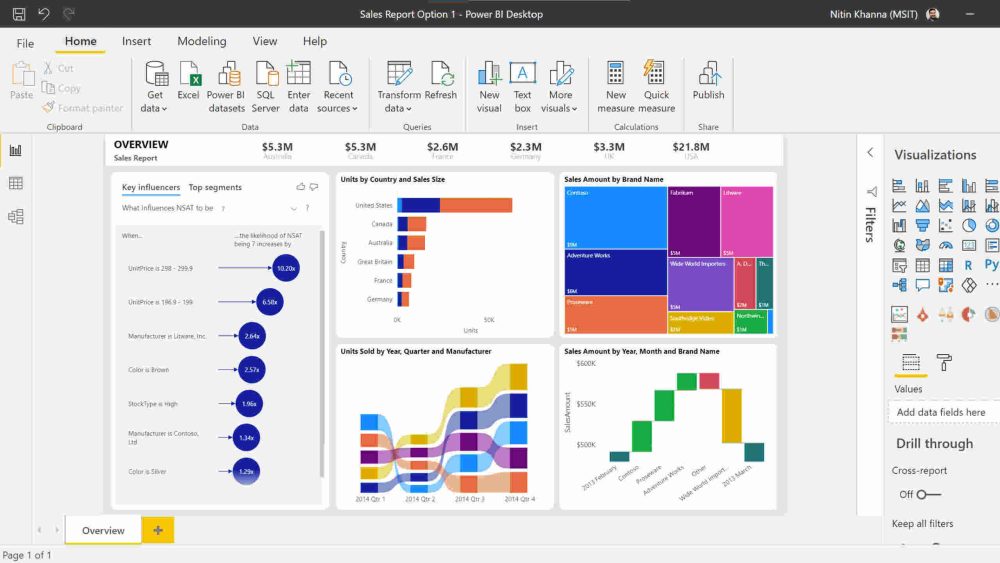
Learn how to create a stunning KPI visual in Power BI with our step-by-step tutorial. Enhance your business intelligence capabilities and transform complex data into actionable insights effortlessly. Dive into the world of data visualization and discover the power of KPIs today.

Explore more AI tools with Textify membership