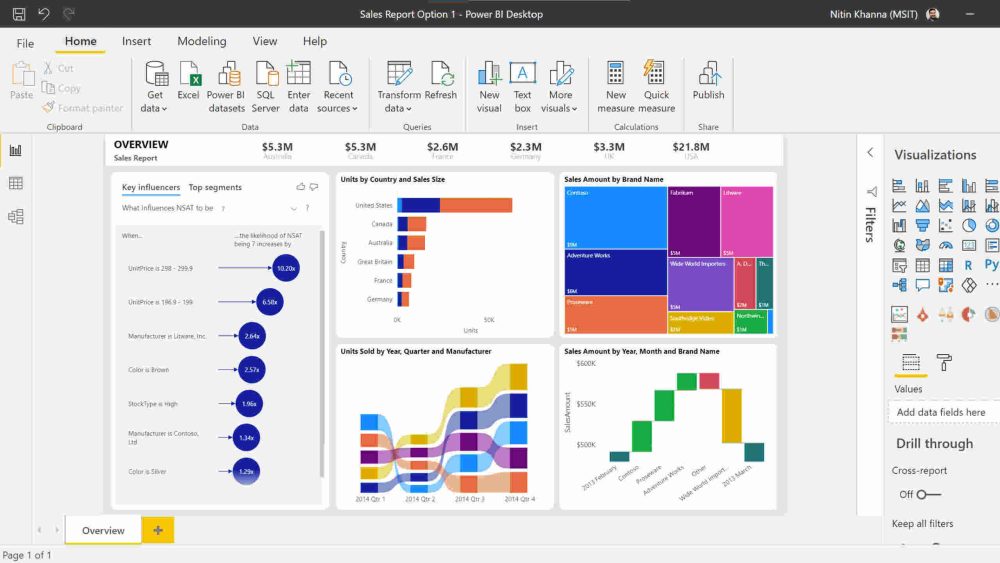
In the ever-evolving landscape of data analytics and business intelligence, Power BI has emerged as a leading tool for transforming complex data into actionable insights. This tutorial aims to guide you through the next level of Key Performance Indicators (KPIs) in Power BI, leveraging advanced data visualization techniques to drive business growth.
Power BI, a product of Microsoft, is renowned for its robust data visualization capabilities. It allows businesses to create interactive and shareable dashboards that provide a 360-degree view of their most critical metrics. With the integration of AI and machine learning, Power BI is set to revolutionize how businesses approach data analysis and decision-making.
Understanding KPIs in Power BI
KPIs are essential metrics that help organizations measure their performance against specific objectives. In Power BI, KPIs are visual cues that indicate whether performance is on track or if corrective actions are needed. They are typically represented using visual elements such as gauges, traffic lights, and trend indicators.
To create a KPI in Power BI, you need three key components:
- Indicator: The actual value you want to measure.
- Target: The goal or benchmark you want to compare the indicator against.
- Trend: The historical data that shows the performance over time.
Step-by-Step Guide to Creating KPIs in Power BI
Let’s dive into the step-by-step process of creating KPIs in Power BI:
1. Data Preparation
Before creating KPIs, ensure your data is clean and well-structured. Power BI supports various data sources, including Excel, SQL Server, and cloud-based services like Azure and Google Analytics. Import your data into Power BI and perform any necessary transformations using Power Query Editor.
2. Creating a KPI Visual
Once your data is ready, follow these steps to create a KPI visual:
- Open Power BI Desktop and load your dataset.
- Navigate to the Visualizations pane and select the KPI visual.
- Drag and drop the Indicator field into the Indicator well.
- Drag and drop the Target field into the Target well.
- Drag and drop the Trend field into the Trend axis well.
The KPI visual will automatically update to reflect the current value, target, and trend. You can customize the visual by adjusting the formatting options, such as colors, labels, and thresholds.
3. Enhancing KPIs with Custom Visuals
Power BI offers a wide range of custom visuals that can enhance the functionality and aesthetics of your KPIs. You can explore the Microsoft AppSource to find and import custom visuals that suit your needs. Some popular custom visuals for KPIs include:
- Bullet Chart: A compact visual that compares the actual value against the target and displays performance bands.
- Gauge: A circular visual that shows the progress towards a goal.
- Card with States: A visual that displays the current value and changes color based on predefined thresholds.
Leveraging AI and Machine Learning in Power BI
With advancements in AI and machine learning, Power BI is poised to take data visualization to the next level. AI-powered features like Power BI Q&A allow users to ask natural language questions and get instant answers in the form of visuals. Additionally, AI Insights can automatically detect patterns and anomalies in your data, providing valuable insights without the need for complex calculations.
For example, AI agents in tools like Tableau can autonomously deliver insights within user workflows, integrating real-time data and suggesting actionable strategies based on historical performance. This shift from traditional reporting to proactive, AI-driven insights is transforming business intelligence.
Best Practices for Effective KPIs
To ensure your KPIs are effective and actionable, consider the following best practices:
- Align KPIs with Business Objectives: Ensure your KPIs are directly linked to your organization’s strategic goals.
- Keep KPIs Simple and Focused: Avoid cluttering your dashboards with too many KPIs. Focus on the most critical metrics that drive performance.
- Regularly Review and Update KPIs: Continuously monitor and update your KPIs to reflect changes in business priorities and market conditions.
- Ensure Data Accuracy: Reliable KPIs depend on accurate and up-to-date data. Implement data governance practices to maintain data quality.
Conclusion
Power BI’s advanced KPI capabilities, combined with AI and machine learning, offer businesses a powerful tool for data-driven decision-making. By following the steps outlined in this tutorial and leveraging best practices, you can create impactful KPIs that drive business growth and performance.
For more detailed guidance on data visualization and business intelligence, explore the Power BI Masterclass and stay updated with the latest trends in data analytics.
Ready to Transform Your Hotel Experience? Schedule a free demo today
Explore Textify’s AI membership
Explore latest trends with NewsGenie
