Academic research is a rigorous process that requires extensive data collection, analysis, and presentation. Research students often struggle with finding credible sources, analyzing trends, and visualizing data effectively. Textify Analytics is a powerful tool that simplifies this process by providing instant access to statistical charts, real-time insights, and AI-driven analytics, helping research students create data-backed academic work with ease.
In this guide, we will explore how Textify Analytics empowers research students by streamlining data analysis, enhancing research quality, and improving the overall academic writing process.
Step 1: Finding Credible Data Sources
One of the biggest challenges research students face is gathering reliable data. Traditional methods involve combing through multiple reports, journal articles, and databases. Textify Analytics eliminates this hassle by offering pre-analyzed data from authoritative sources.
How Textify Analytics helps:
- Provides access to government reports, industry studies, and academic datasets.
- Offers searchable data categories for specific research fields (e.g., economics, healthcare, education, technology).
- Saves time by eliminating manual data collection and verification.
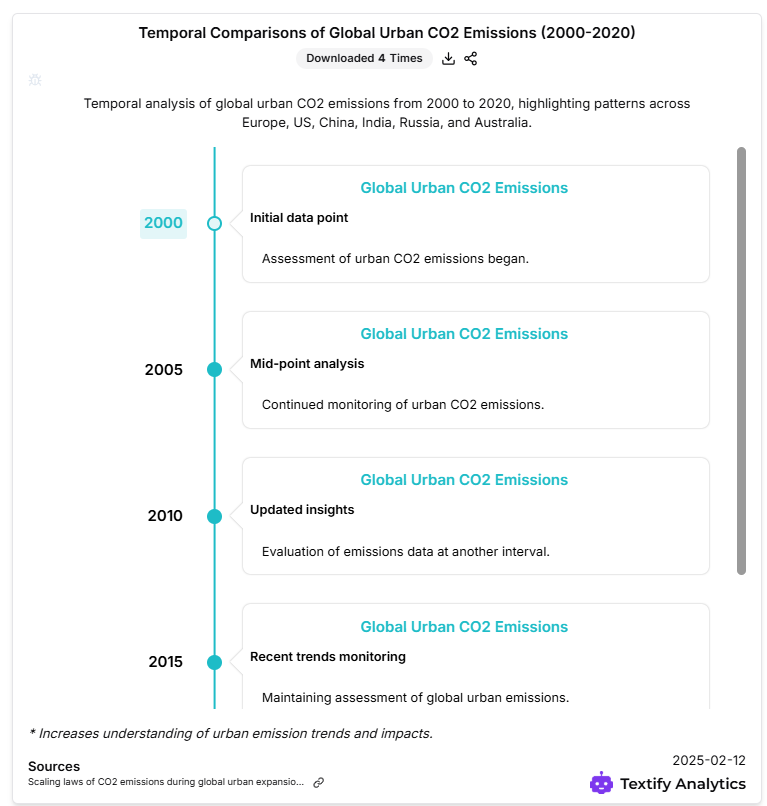
For example, a student researching climate change impact on global economies can instantly find CO2 emission trends, economic cost analyses, and temperature change statistics through Textify Analytics.
Step 2: Generating Visual Data for Research Papers
A well-structured research paper should not only present findings but also support them with compelling visual evidence. However, creating graphs manually can be time-consuming.
How Textify Analytics helps:
- Instantly generates charts, bar graphs, scatter plots, and heatmaps from selected data.
- Allows downloading of high-resolution graphs for seamless integration into research papers.
Examples:
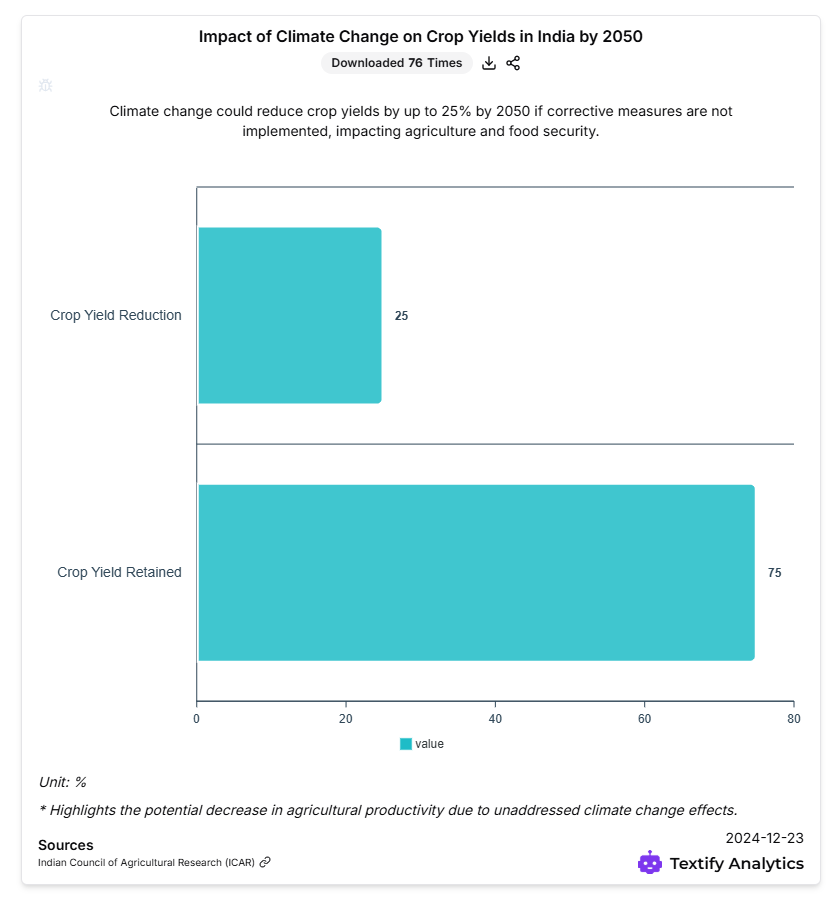
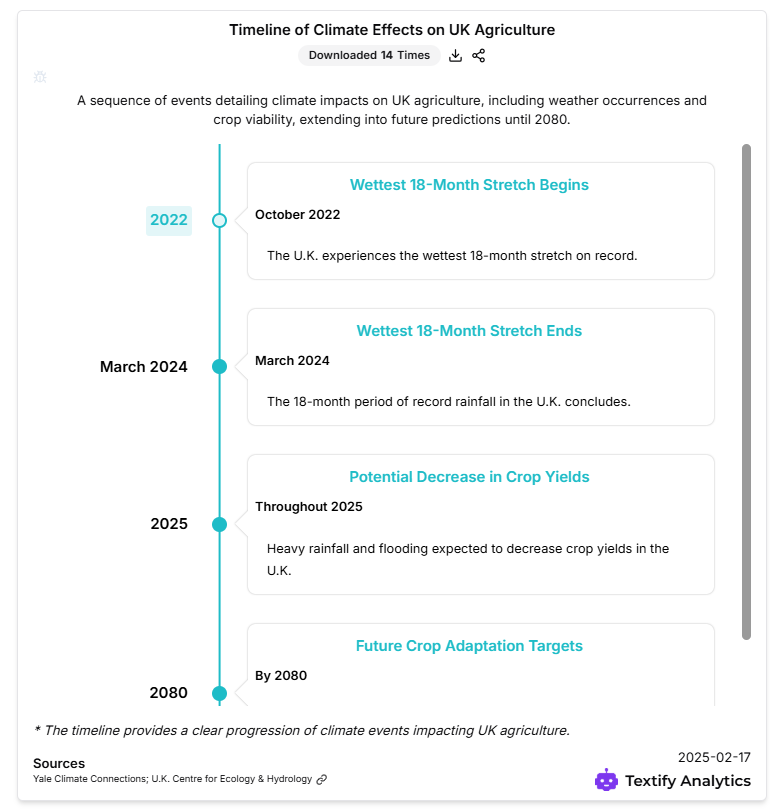
A graduate student researching the impact of climate change on agriculture used Textify Analytics to pull real-time data on temperature variations, crop yields, and precipitation trends. By analyzing multiple datasets, the student identified key climate patterns affecting food production, which strengthened their research arguments.
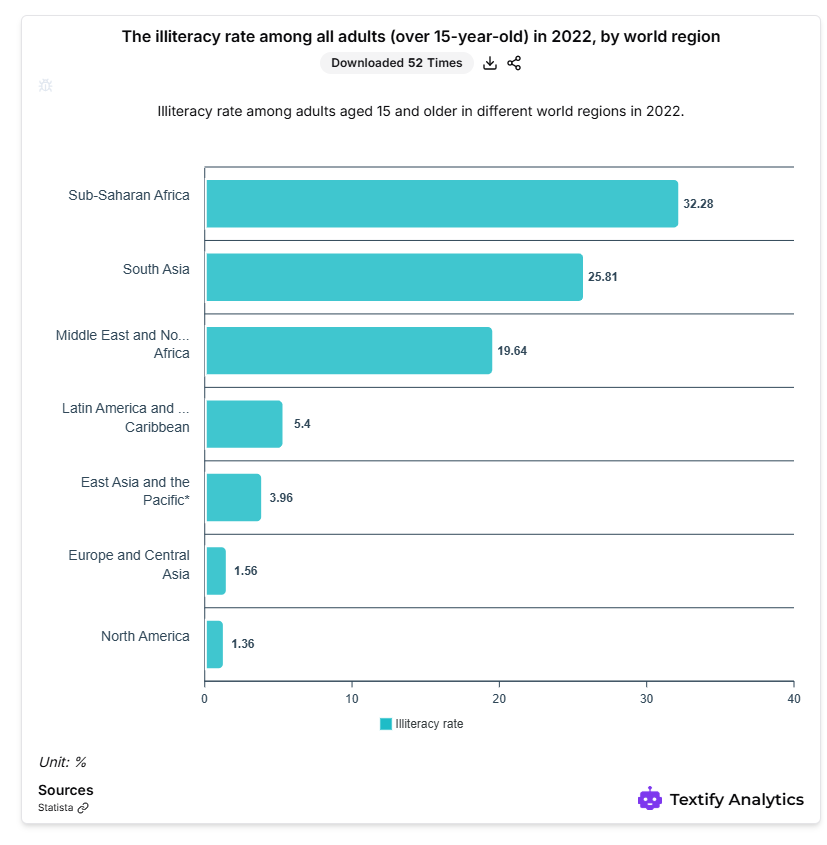
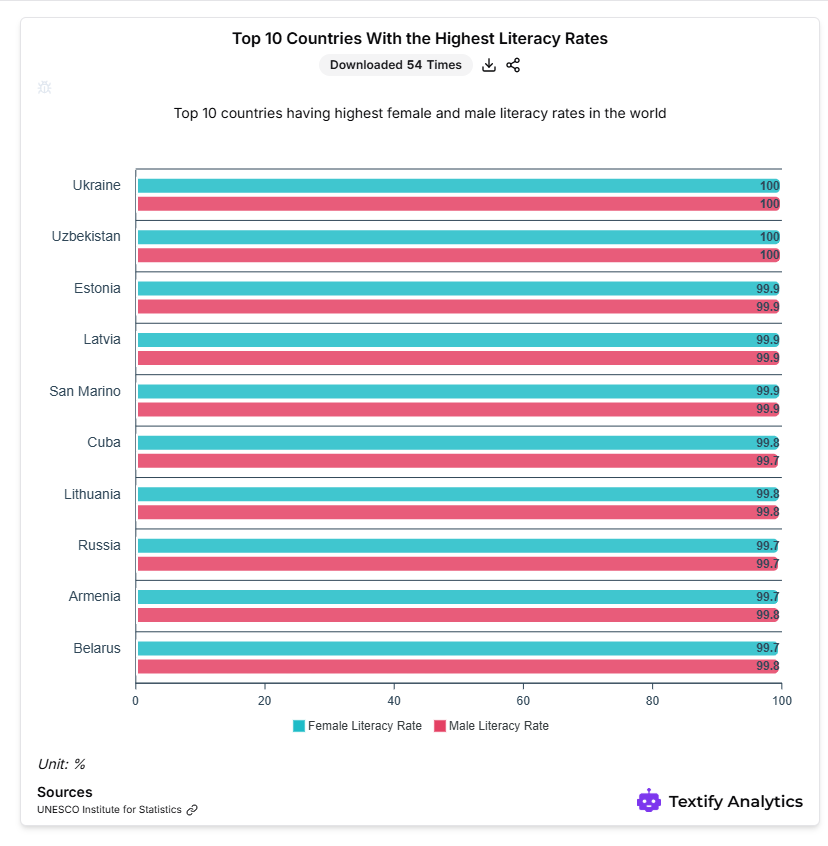
A student analyzing global literacy rates over the past two decades used Textify Analytics generate comparative charts showing trends across different countries in just a few clicks.
Step 3: Comparative Data Analysis for Stronger Arguments
A good research paper often involves comparing different variables to draw meaningful conclusions. However, manually correlating multiple datasets can be complex and error-prone.
How Textify Analytics helps:
- Uses historical tracking to observe long-term changes in research fields.
- Provides AI-driven insights to detect trends and correlations between factors.
For example, a student working on the relationship between unemployment rates and higher education enrolment can compare **past trends.
Explore Textify’s AI membership
Be updated with Textify News
Need a Chart? Explore the world’s largest Charts database

